D24
Flagship ProgramHigh DemandData & AIBeginner6 weeks
Data Analytics
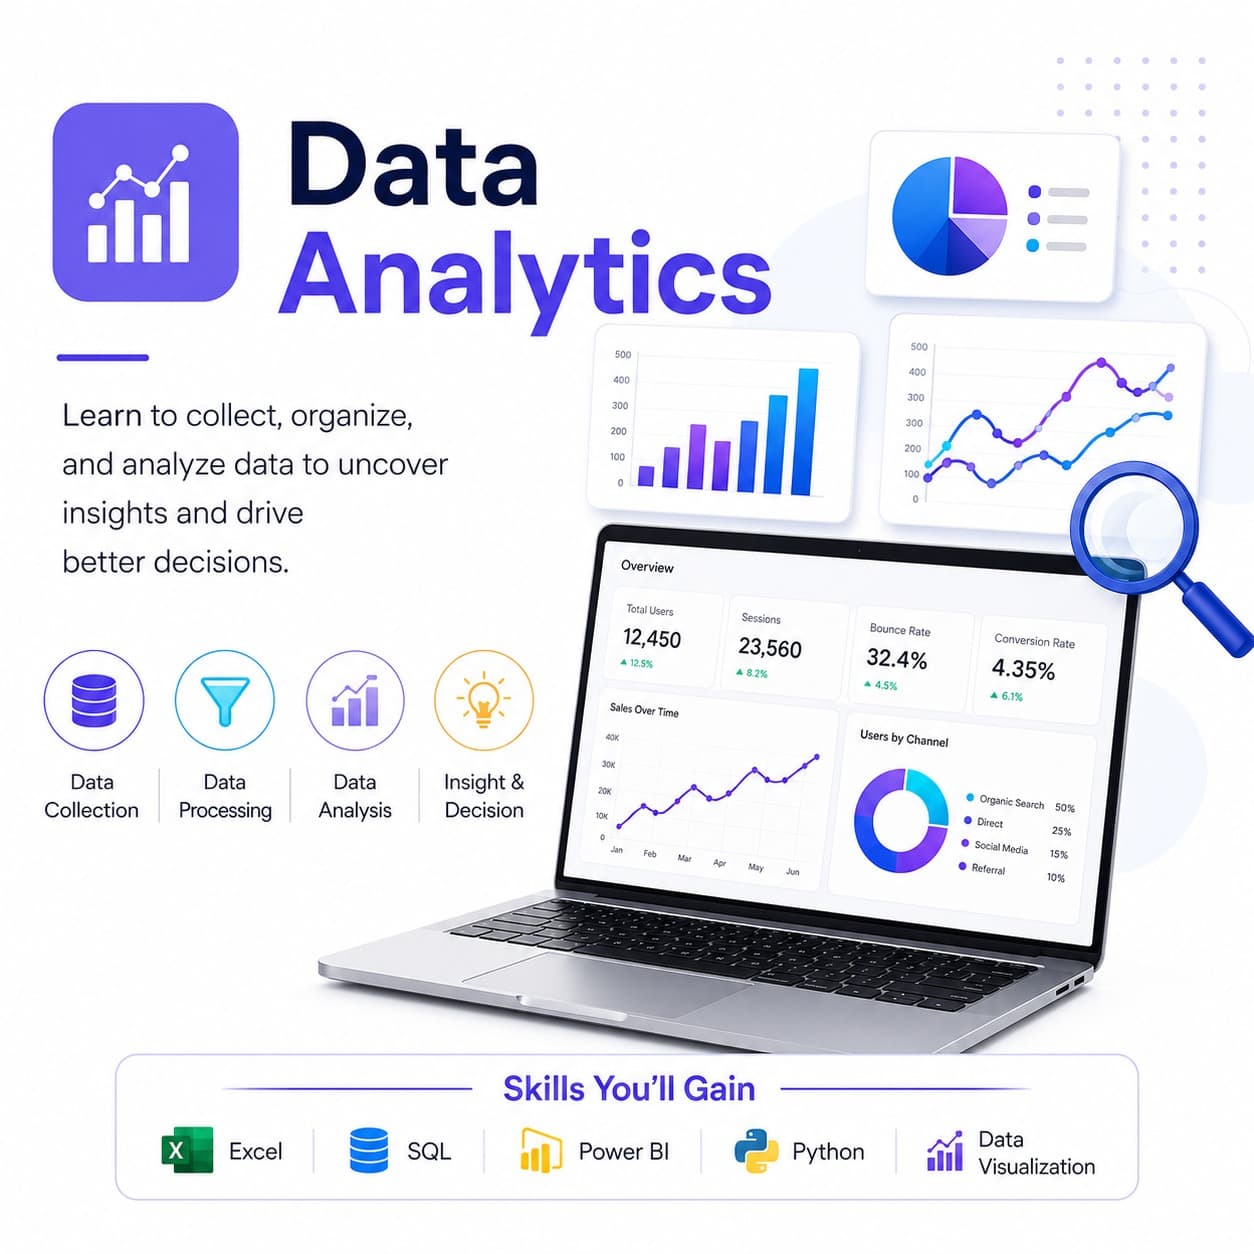
Data Analytics is a 6-week beginner course teaching Excel, SQL, and Python for data cleaning, exploratory analysis, and Power BI dashboards. Learners build a capstone analyzing a real dataset end-to-end, plus projects like a sales dashboard and churn analysis, gaining the skills to turn raw business data into clear, decision-ready insights.
Turn raw spreadsheets into dashboards that get you hired — hands-on SQL, Python, and Power BI, capped with a portfolio project that proves it.
What you'll learn
Data cleaning and preparation with Python and Excel
Exploratory analysis and visualization techniques
Building dashboards that communicate insights clearly
A capstone project analyzing a real-world dataset end-to-end
Course details
Duration
6 weeks
Best for
Beginners who want to work confidently with real business data
Enrollment isn't open for this course yet — check back soon or contact us.
Course Curriculum
A module-by-module breakdown of what you'll cover in Data Analytics.
01Part 1: Basic Statistics
6 topicsWeek 1
- Introduction to Data Analytics
- Population Sampling and Data Collection
- Descriptive Statistics
- Probability and Distributions
- Relationships and Statistical Testing
- Business Analysis Techniques
02Part 2: Microsoft Excel
7 topicsWeek 2
- Getting Started with Excel
- Formatting and Data Entry
- Formulas and Core Functions
- Text Date and Lookup Functions
- Data Cleaning and Preparation
- Analysis with Pivot Tables
- Charts Dashboards and Power Query
03Part 3: SQL
7 topicsWeek 3
- Database Fundamentals
- Basic Data Retrieval
- Functions Grouping and Business Logic
- Joins and Set Operations
- Subqueries CTEs and Views
- Window Functions and Advanced Analysis
- Data Quality and Query Performance
04Part 4: Python for Data Analytics
8 topicsWeek 4
- Setup and Python Fundamentals
- Data Structures and Program Flow
- Functions Modules and Error Handling
- NumPy
- Pandas Fundamentals
- Cleaning and Transforming Data
- Visualisation and Exploratory Data Analysis
- Data Connections and Automation
05Part 5: Microsoft Power BI
8 topicsWeek 4
- Power BI Fundamentals
- Power Query
- Data Modelling
- DAX Fundamentals
- Time Intelligence
- Visualisation and Interaction
- Dashboard Design and Storytelling
- Publishing Security and Performance
06Part 6: Projects and Portfolio
2 topicsWeek 5
- Tool Based Mini Projects
- Final Integrated Capstone Project
07AI Pro
4 topicsWeek 6
- Using Claude, ChatGPT, and Perplexity to accelerate cleaning and EDA
- Natural-language-to-SQL tools and LLM APIs for text data
- Verifying AI-generated analysis before trusting it
- Project: AI-Assisted Analytics Workflow
Tools & Technologies
Hands-on practice with the same tools used by working professionals.
Python
SQLSQL (PostgreSQL/BigQuery)
Power BI
Excel
JnJupyter Notebook
sciscikit-learn
ClaClaude / ChatGPT
Want to learn just one piece first?
Data Analytics bundles all of these into one program — but each is also available as its own standalone course if you'd rather learn (or brush up on) a single skill first.
Need this built for your business instead?
If you'd rather have it done than learn it, our solutions team delivers this work for businesses directly.
Real-Time, Industry-Based Projects
This is project-based learning modeled on real industry scenarios — you'll build portfolio-ready work as you go, not just watch lectures.
Retail sales performance dashboard modeling a multi-table dataset with drill-down KPIs
Customer churn analysis with EDA and a baseline classification model
Marketing A/B test readout with a significance test and a ship/no-ship recommendation
Support-ticket insight pipeline using an LLM API to classify topics and sentiment at scale
Automated weekly report generator that drafts narrative summaries from fresh data
Every course includes a guided internship on top of your project work — so you graduate with real experience, not just a certificate.
Communication & Soft Skills
Built into every course, alongside the technical curriculum.
Communication Skills
Practice explaining technical work clearly to teammates, managers, and clients.
Practical AI Skills
Hands-on training in using AI tools well — prompting, everyday workflows, and where AI actually helps versus where it doesn't.
Teamwork & Collaboration
Work in small project teams using real workflows like stand-ups and code reviews.
Problem Solving
Build the habit of breaking down ambiguous problems into clear, solvable steps.
Time Management
Learn to plan, prioritize, and deliver project work against realistic deadlines.
Presentation Skills
Present your project work and results with confidence, as you would to a client.
Resume & Profile Building
Build a strong resume, LinkedIn profile, and project portfolio that recruiters notice.
Interview Preparation
Mock interviews and portfolio reviews to get you ready for real job applications.
Career & Placement Support
100% of students enrolled in Data Analytics get full access to placement support — real tools and guidance, not just a promise. This is support and access, not a guaranteed job outcome.
Resume Builder
A resume auto-built from your real completed projects and certificates, ready to export.
Shareable Portfolio
A public portfolio page showcasing your approved projects, with a link you can share with employers.
Interview Preparation
Guidance on presenting your projects and experience clearly in real interviews.
Peer & Mentor Community
Ongoing access to our learner community for questions, feedback, and support after you finish.
What Your Certificates Look Like
Real, verifiable certificates with your name, Data Analytics, and a QR code anyone can scan to confirm they're genuine — one for completing the course, and a separate one if you take the internship track.
Course Completion Certificate
SAMPLE

 Data24Zone
Certificate of Completion
Illustrative recipient
Your Name Here
Example certificate for completion of
Data Analytics
- Certificate No.
- D24-SAMPLE
- Mode
- Self-Paced
- Duration
- 6 weeks
- Example issue date
- On completion
Sample only — not a real, issued certificate.
Verification is available only on issued certificates.
Internship Completion Certificate
SAMPLE
Data24ZoneCertificate of Internship
Illustrative recipient
Your Name Here
Example certificate for completion of
Data Analytics
- Certificate No.
- D24-SAMPLE
- Mode
- Internship
- Duration
- 6 weeks
- Example issue date
- On completion
Sample only — not a real, issued certificate.
Verification is available only on issued certificates.
Student Reviews
5.0average student rating
“I learned data analytics from Prasanth in the Master Program in Data Analytics. He has deep expertise in Python, Excel, SQL, and Power BI, and makes even complex topics feel simple.”
Akhash S.S
Accountant
“Prasanth made complex data analytics concepts easy to understand, with clear, practical guidance on data cleaning, visualization, and interpreting insights.”
Jaraan Ar
Data Analyst
Frequently Asked Questions
What is data analytics?
Data analytics is the practice of cleaning, querying, analysing, and visualising data to answer business questions and support decisions. It combines statistics with tools such as Excel, SQL, Python, and BI dashboards.
Who can become a data analyst?
Anyone comfortable with numbers and logical thinking — graduates from any stream, working professionals switching careers, or people in finance, sales, or operations who already work with spreadsheets. The Data Analytics program starts from basic statistics, so no analytics background is required.
Does data analytics require coding?
Some. Much analysis is done in Excel and Power BI without code, but SQL and Python are standard for querying and automating work. The program teaches them in order: statistics and Excel first, then SQL, then Python, then Power BI.
What will I learn in the Data Analytics course?
You'll learn: Data cleaning and preparation with Python and Excel; Exploratory analysis and visualization techniques; Building dashboards that communicate insights clearly; A capstone project analyzing a real-world dataset end-to-end.
What tools and technologies does the Data Analytics course cover?
This course covers: Python, SQL (PostgreSQL/BigQuery), Power BI, Excel, Jupyter Notebook, scikit-learn, Claude / ChatGPT.
Is the Data Analytics course beginner-friendly?
Yes — this is a beginner-level course.
How long does the Data Analytics course take to complete?
The course is designed to be completed in approximately 6 weeks, depending on your pace.
What enrollment options are available for Data Analytics?
Live Class (₹12,999) — Instructor-led live cohort with doubt-clearing sessions — includes both the course and internship certificates. Recorded Batch (₹7,999) — Full recordings of a completed live batch — includes both the course and internship certificates. Internship (₹2,499) — Work through real projects with our team and earn an internship certificate (course certificate not included). Self-Paced (₹4,999) — Learn anytime with the full recorded curriculum and community access.
Is there an internship option for Data Analytics?
Yes — enrolling in the Internship track (or the Live/Recorded tracks, which include it) means working through real projects with our team and earning a separate Internship Certificate, in addition to the course completion certificate for Live/Recorded enrollments.
Will I get a certificate after completing Data Analytics?
Yes. Self-paced enrollment earns a course completion certificate once your final project is reviewed and approved. Internship enrollment earns an internship certificate once your internship projects are approved. Live and Recorded enrollments earn both. Every certificate is publicly verifiable on our website and can be added directly to your LinkedIn profile.
What kind of projects will I build in Data Analytics?
You'll work on real projects such as: Retail sales performance dashboard modeling a multi-table dataset with drill-down KPIs; Customer churn analysis with EDA and a baseline classification model; Marketing A/B test readout with a significance test and a ship/no-ship recommendation; Support-ticket insight pipeline using an LLM API to classify topics and sentiment at scale; Automated weekly report generator that drafts narrative summaries from fresh data.
Is placement support included with Data Analytics?
Yes — every enrolled student gets full access to our placement support: resume building, a shareable project portfolio, mock interview preparation, and guidance applying what you've built to real job applications. This is support and access, not a guaranteed job outcome — how quickly it leads to an offer depends on the market and your own effort.