D24
Advanced SpecializationData & AIIntermediate8 weeks
Python Data Visualization
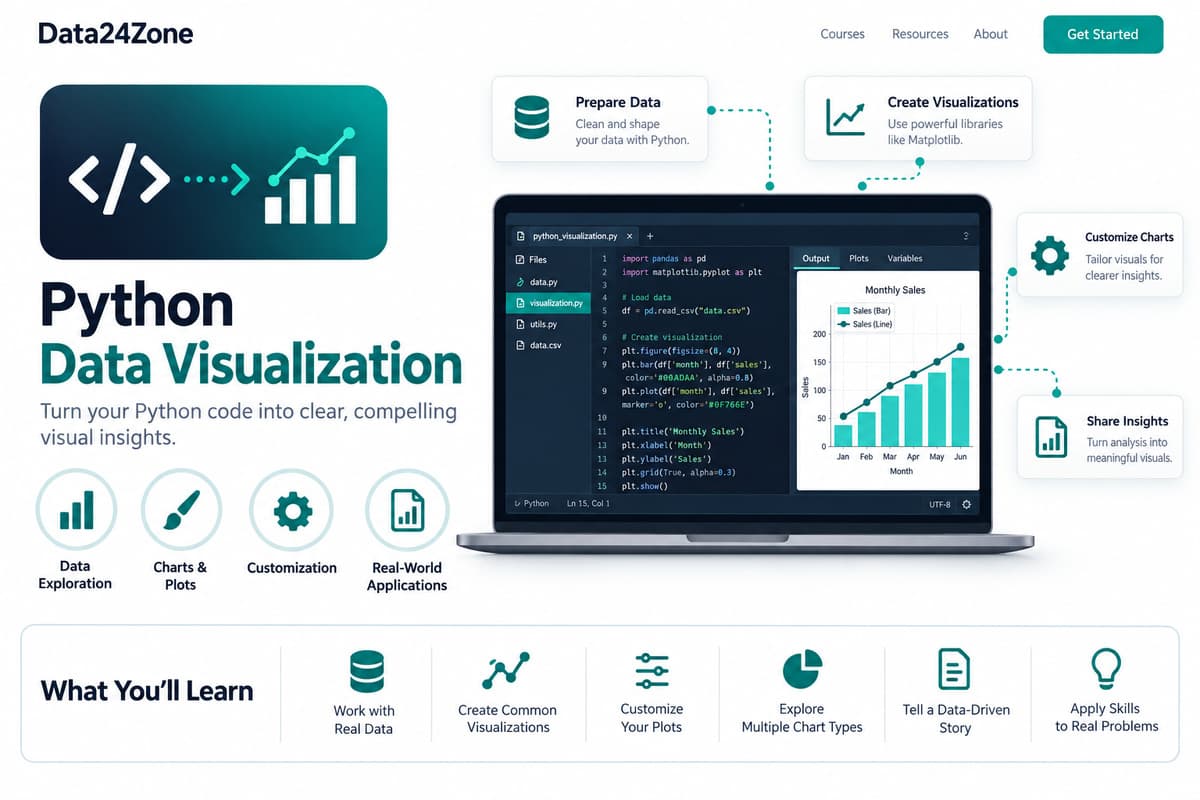
Python Data Visualization is an intermediate, 8-week course for learners who already know Python, pandas basics and descriptive statistics. It teaches creating accurate, readable analytical figures using Matplotlib, Seaborn and Plotly, with deliberate visual encodings, honest scales, and reproducible data preparation, culminating in an enrollment analysis figure-pack project with reproducible scripts.
Create accurate, readable analytical figures with deliberate encodings, scales and reproducible data preparation.
What you'll learn
Validate data before trusting the report
Define a metric’s grain, denominator and decision
Choose visual encodings that match the comparison
Build figures through explicit axes and reproducible data
Course details
Duration
8 weeks
Best for
Learners who already have: Python, pandas basics and descriptive statistics.
Enrollment isn't open for this course yet — check back soon or contact us.
Course Curriculum
A module-by-module breakdown of what you'll cover in Python Data Visualization.
01Basic
4 topicsWeeks 1–2
- Why visualize data? Choosing the right chart type
- Matplotlib basics: building your first charts
- Visualizing DataFrames directly with Pandas and Seaborn
- Project: Visualize a sales dataset with multiple chart types
02Intermediate
4 topicsWeek 3
- Avoiding misleading charts: axis truncation and scale choices
- Multi-panel figures and subplots
- Color choices: accessibility and perceptual accuracy
- Project: Build an honest, accessible multi-panel report
03Advanced
3 topicsWeeks 4–5
- Validate data before trusting the report
- Define a metric's grain, denominator and decision
- Choose visual encodings that match the comparison
04Pro
4 topicsWeek 6
- Interactive visualizations with Plotly
- Visualizing large datasets: sampling and aggregation strategies
- Building a dashboard: combining multiple visualizations coherently
- Project: Build an interactive dashboard for a large dataset
05AI Pro
3 topicsWeeks 7–8
- Using AI tools (ChatGPT, Claude, Perplexity) to draft visualization code and chart choices faster
- Verifying AI-suggested charts don't mislead your audience
- Project: Use AI to draft a report chart, then audit it for honesty and clarity
Tools & Technologies
Hands-on practice with the same tools used by working professionals.
MatMatplotlib
SeaSeaborn
PloPlotly
PdPandas
ChaChatGPT
ClaClaude
PerPerplexity
Real-Time, Industry-Based Projects
This is project-based learning modeled on real industry scenarios — you'll build portfolio-ready work as you go, not just watch lectures.
Enrollment analysis figure pack with annotated findings and reproducible scripts
Every course includes a guided internship on top of your project work — so you graduate with real experience, not just a certificate.
Communication & Soft Skills
Built into every course, alongside the technical curriculum.
Communication Skills
Practice explaining technical work clearly to teammates, managers, and clients.
Practical AI Skills
Hands-on training in using AI tools well — prompting, everyday workflows, and where AI actually helps versus where it doesn't.
Teamwork & Collaboration
Work in small project teams using real workflows like stand-ups and code reviews.
Problem Solving
Build the habit of breaking down ambiguous problems into clear, solvable steps.
Time Management
Learn to plan, prioritize, and deliver project work against realistic deadlines.
Presentation Skills
Present your project work and results with confidence, as you would to a client.
Resume & Profile Building
Build a strong resume, LinkedIn profile, and project portfolio that recruiters notice.
Interview Preparation
Mock interviews and portfolio reviews to get you ready for real job applications.
Career & Placement Support
100% of students enrolled in Python Data Visualization get full access to placement support — real tools and guidance, not just a promise. This is support and access, not a guaranteed job outcome.
Resume Builder
A resume auto-built from your real completed projects and certificates, ready to export.
Shareable Portfolio
A public portfolio page showcasing your approved projects, with a link you can share with employers.
Interview Preparation
Guidance on presenting your projects and experience clearly in real interviews.
Peer & Mentor Community
Ongoing access to our learner community for questions, feedback, and support after you finish.
What Your Certificates Look Like
Real, verifiable certificates with your name, Python Data Visualization, and a QR code anyone can scan to confirm they're genuine — one for completing the course, and a separate one if you take the internship track.
Course Completion Certificate
SAMPLE

 Data24Zone
Certificate of Completion
Illustrative recipient
Your Name Here
Example certificate for completion of
Python Data Visualization
- Certificate No.
- D24-SAMPLE
- Mode
- Self-Paced
- Duration
- 8 weeks
- Example issue date
- On completion
Sample only — not a real, issued certificate.
Verification is available only on issued certificates.
Internship Completion Certificate
SAMPLE
Data24ZoneCertificate of Internship
Illustrative recipient
Your Name Here
Example certificate for completion of
Python Data Visualization
- Certificate No.
- D24-SAMPLE
- Mode
- Internship
- Duration
- 8 weeks
- Example issue date
- On completion
Sample only — not a real, issued certificate.
Verification is available only on issued certificates.
Frequently Asked Questions
What will I learn in the Python Data Visualization course?
You'll learn: Validate data before trusting the report; Define a metric’s grain, denominator and decision; Choose visual encodings that match the comparison; Build figures through explicit axes and reproducible data.
What tools and technologies does the Python Data Visualization course cover?
This course covers: Matplotlib, Seaborn, Plotly, Pandas, ChatGPT, Claude, Perplexity.
Is the Python Data Visualization course beginner-friendly?
This is a intermediate-level course, so it assumes some prior familiarity with the subject.
How long does the Python Data Visualization course take to complete?
The course is designed to be completed in approximately 8 weeks, depending on your pace.
What enrollment options are available for Python Data Visualization?
Internship (₹2,499) — Work through real projects with our team and earn an internship certificate (course certificate not included). Self-Paced (₹1,999) — Learn anytime with the full recorded curriculum and community access.
Is there an internship option for Python Data Visualization?
Yes — the Internship track means working through real projects with our team and earning a separate Internship Certificate.
Will I get a certificate after completing Python Data Visualization?
Yes. Self-paced enrollment earns a course completion certificate once your final project is reviewed and approved. Internship enrollment earns an internship certificate once your internship projects are approved. Every certificate is publicly verifiable on our website and can be added directly to your LinkedIn profile.
What kind of projects will I build in Python Data Visualization?
You'll work on real projects such as: Enrollment analysis figure pack with annotated findings and reproducible scripts.
Is placement support included with Python Data Visualization?
Yes — every enrolled student gets full access to our placement support: resume building, a shareable project portfolio, mock interview preparation, and guidance applying what you've built to real job applications. This is support and access, not a guaranteed job outcome — how quickly it leads to an offer depends on the market and your own effort.